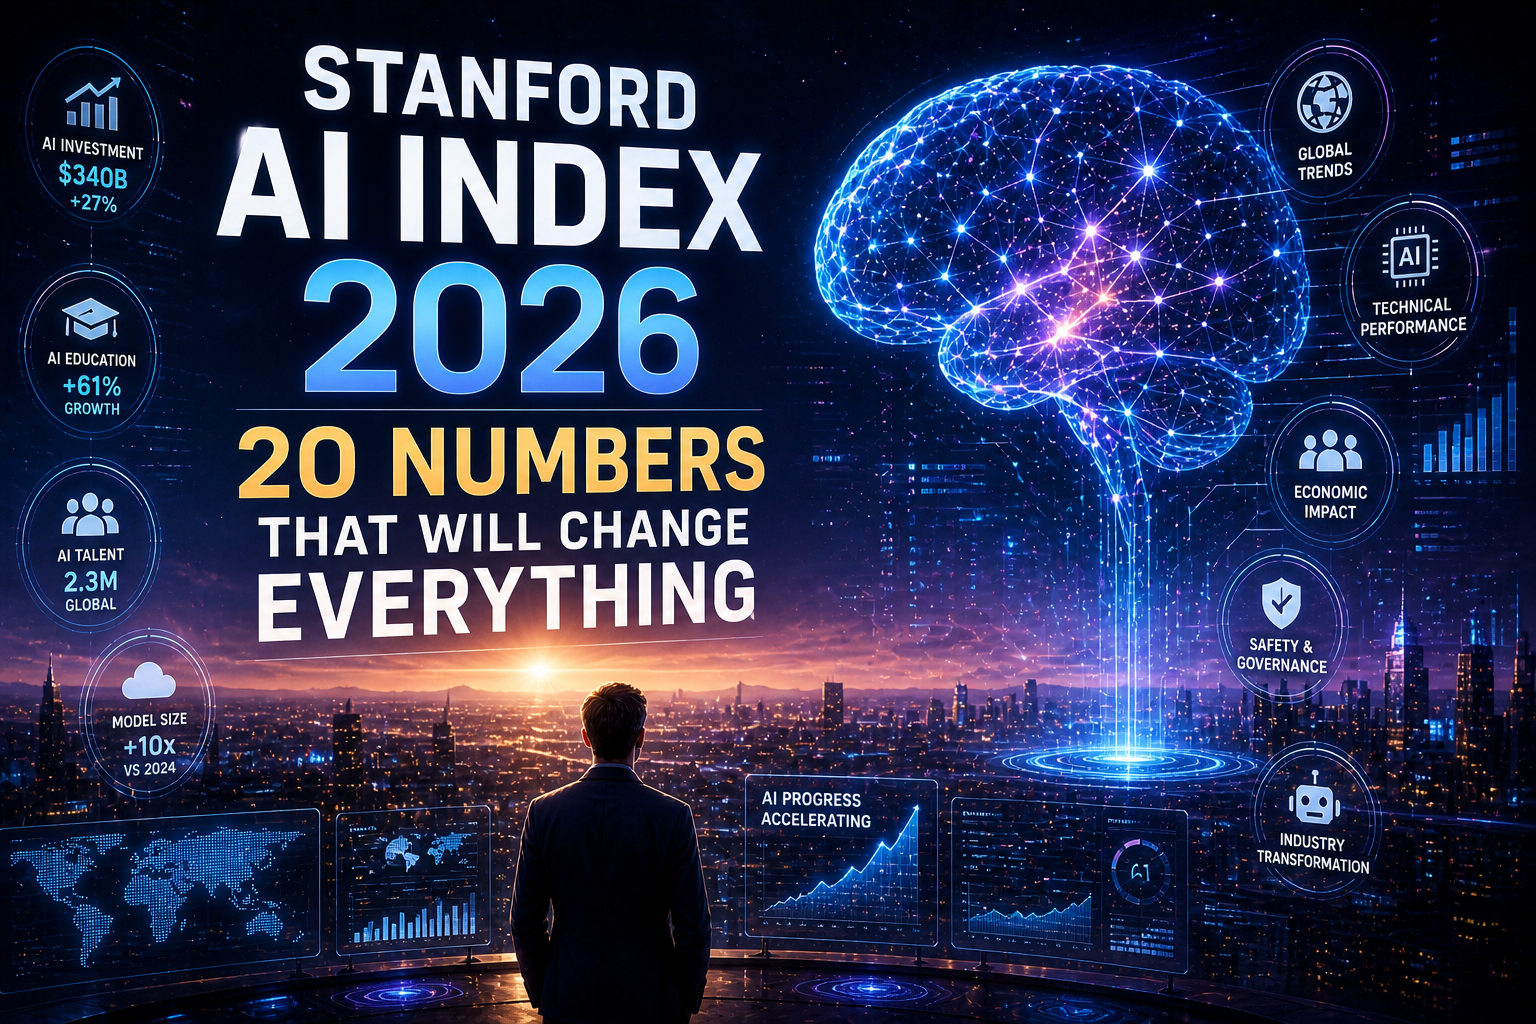
How You See AI Forever
400 pages. 9 chapters. Hundreds of independent datasets. Stanford’s ninth annual AI Index
delivers hard truths about the real state of artificial intelligence — the breathtaking, the alarming,
and the deeply contradictory. Here is every number that matters, fully explained.
What the Stanford AI Index Is and Why It’s the Only Report That Matters
The AI industry generates hundreds of reports every year. Most of them are produced by companies that sell AI products and have an obvious interest in reporting that AI is wonderful. The Stanford AI Index is different in a way that matters: it is produced by researchers with no stake in any particular AI outcome, drawing on data from governments, independent academic institutions, and third-party measurement organizations.
The 2026 edition, now in its ninth year, covers nine chapters: technical performance, the economy, education, science and medicine, the workforce, policy, public opinion, the environment, and the global competitive landscape. It draws on literally hundreds of independent datasets. It is, without serious competition, the most comprehensive and credible annual measurement of where AI actually stands — not where the companies building it say it stands.
Why this report matters now more than ever: The 2026 AI Index finds that capability is accelerating, the US-China model gap has effectively closed, and responsible AI reporting is lagging significantly behind capability development. In plain terms: the engine is accelerating, the dashboard lights are coming on, and the brakes are still in the design phase.
The Historic Adoption Number: 53% of Humanity in Three Years
If there is a single number from this report that deserves to stop you cold, it is this one:
— Stanford HAI 2026 AI Index Report, Economy Chapter
Think carefully about what this means. The personal computer — one of the most transformative technologies in human history — took years longer to reach this level of adoption. The internet did too. Generative AI did it in three years. And crucially, most of these tools remain free or close to it — which is why the adoption curve is so steep. You don’t need to buy hardware. You don’t need a service contract. You type a sentence and get a result.
Three factors explain the unprecedented speed. First, the interface is trivially simple — a conversation box that almost anyone can use on day one. Second, the value is immediate and obvious — writing, coding, research, summarization are all tasks people needed help with before AI existed. Third, the cost to try is essentially zero, removing the friction that slowed every previous technology wave.
The full historical comparison: Radio: 38 years to reach 50 million users. Television: 13 years. The internet: 4 years. The smartphone: 5 years to comparable adoption. ChatGPT: 60 days to 100 million users. Generative AI broadly: 3 years to half of humanity. No technology in recorded history has penetrated human life at this pace. This is not hyperbole. It is the data.
The Geographic Paradox: The US Is 24th in Adoption Despite Leading in Investment
Here is where the picture becomes genuinely surprising. The United States is the single largest investor in AI on the planet. Its companies build the most powerful models. Its developers are the most numerous. And yet when you ask who is actually using AI in daily life — the United States ranks 24th at 28.3%, despite leading the world in AI investment and model development.
Some countries show higher-than-expected adoption, such as Singapore (61%) and the United Arab Emirates (54%), while the U.S. ranks 24th at 28.3%. Countries in the Middle East, South Asia, and Sub-Saharan Africa are adopting AI at rates that far outpace what their income levels would predict — in part because AI tools offer a genuine technological leap for populations that previously lacked access to sophisticated professional services.
The American paradox explained: The US gap between leading in AI creation and lagging in AI adoption reflects cultural skepticism, digital literacy divides, privacy concerns, and a lack of institutional adoption mandates. Countries with high adoption rates are largely those with strong government-led integration programs or populations with high AI tool dependency for economic mobility. The pattern suggests that building the technology and benefiting from it are two very different challenges.
Capability Is Not Plateauing: From SWE-bench to a Math Olympiad Gold Medal
There is a recurring narrative in some technology circles that AI progress has “hit a wall.” The Stanford data does not support this narrative. At all.
SWE-bench: 60% to Near 100% in One Year
On a key coding benchmark — SWE-bench Verified — performance rose from 60% to nearly 100% of the human baseline in a single year. SWE-bench tests whether AI can resolve real GitHub issues from actual open-source projects — the kind of messy, context-dependent coding problems humans struggle with. Going from 60% to near-100% in 12 months is not incremental improvement. It is a category shift.
The fastest benchmark improvement in AI history
Gemini Deep Think: Gold Medal at the International Math Olympiad
Gemini Deep Think earned a gold medal at the International Mathematical Olympiad. Not silver. Not a participation certificate. Gold — at a competition designed by the world’s best mathematicians to challenge the sharpest teenage minds on the planet. This happened in 2026, and a surprising number of people in technology haven’t fully processed what it means.
A genuinely historic moment in AI capability
Frontier Models Now Exceed Human Performance on PhD-Level Science
Frontier models now exceed human performance on PhD-level science questions and in competitive mathematics. Several models meet or exceed human baselines on multimodal reasoning and competition mathematics. The researchers who spent decades learning to answer these questions are now being outscored by systems that learned from their published work.
Beyond expert human performance
AI Agents: 20% to 77% Success Rate in One Year
AI agents handling real-world tasks improved from a 20% success rate in 2025 to 77% today. An AI agent is different from a language model — it acts independently, uses tools, navigates multi-step processes. This 3.85× improvement in a single year is what’s driving the accelerating impact on real-world workflows and employment.
3.85× improvement — the workforce impact driver
The US-China AI Gap Has Effectively Closed to 2.7%
Perhaps the most geopolitically charged finding in the 2026 Stanford report concerns the US-China AI competition — and the news is dramatic.
— Stanford HAI 2026 AI Index, Global Competition Chapter
| Dimension | 🇺🇸 United States | 🇨🇳 China | Leader |
|---|---|---|---|
| Frontier Model Performance | Claude leads by 2.7% | DeepSeek, Alibaba competitive | 🇺🇸 Thin margin |
| Private AI Investment (2025) | $285.9 billion | Significantly less (private) | 🇺🇸 Clear lead |
| State-Backed AI Funding (since 2000) | CHIPS Act $52B | ~$184 billion state funds | 🇨🇳 Historically larger |
| Research Publication Volume | High | Leading globally | 🇨🇳 Leader |
| Research Citations | High impact | Leading by volume | 🇨🇳 By volume |
| Total Patent Output | High | Global leader | 🇨🇳 Leader |
| Patents Per Capita | High | South Korea leads globally | 🇰🇷 S. Korea |
| Industrial Robot Installations | Strong | Global leader by number | 🇨🇳 Leader |
| Talent Immigration (inflow) | Down 80% last year | Internal development focus | ❌ US losing ground |
The nuanced picture: One important caveat: China’s government has deployed an estimated $184 billion in state-backed guidance funds into AI firms since 2000, which means private investment comparisons likely understate China’s total AI spending. The US still leads on frontier model quality and per-impact patent productivity. But the gap that once felt insurmountable is now a 2.7% performance margin — and it has been zero multiple times in the past 12 months.
The Money: $582 Billion Invested in a Single Year — 130% Growth
The investment numbers in the 2026 Stanford report require a moment of silence. Not because they’re good or bad — but because the scale is genuinely difficult to absorb.
— Stanford HAI 2026 AI Index, Economy Chapter
To put $582 billion in context: that is roughly $1.6 billion flowing into AI every single day of 2025. On weekends. On holidays. This is not speculative investment in a promising technology. This is the largest capital reallocation in the history of technology — and it accelerated in 2025, not slowed down.
What this means for the next decade: Five hyperscalers now control more than two-thirds of global AI compute. Many AI labs and startups are entirely dependent on these providers for access to the compute required to train and serve frontier models. This concentration creates systemic fragility — an outage, policy change, or pricing shift at a single provider can affect the entire ecosystem.
The Consumer Value Nobody Talks About: $172 Billion Flowing to Ordinary People
One of the most persistent critiques of AI is that the value flows to companies, not to users. The Stanford data tells a more complicated story — and for once, it’s a story that favors consumers.
— Stanford HAI 2026 AI Index, Economy Chapter
“Consumer surplus” is an economics term that means: the value people would be willing to pay minus what they actually pay. If someone would happily pay $50 per month for Claude but only pays $20, their surplus is $30. Multiplied across tens of millions of users, this adds up to $172 billion annually — real value being captured by ordinary people from tools that are largely free.
Medicine: 83% Less Time Writing Notes
AI tools that automatically generate clinical notes from patient visits saw substantial adoption in 2025. Physicians reported up to 83% less time spent writing notes and significant reductions in burnout. The evidence base for clinical outcomes remains thin, but the administrative impact is real.
Measurable time savings
Marketing: Up to 72% Productivity Gains
Productivity gains across marketing (up to 72%), software development (14–26%), and customer support (14–26%) suggest that AI is augmenting output for workers who remain employed. Smaller teams are achieving what previously required larger ones.
Real, measurable productivity
88% of Organizations Use AI
Organizational adoption reached 88% of surveyed companies. AI is no longer a competitive differentiator in most industries — it is table stakes. Companies that don’t use it are now the anomaly, not companies that do.
Infrastructure, not advantage
Median Value Per User Tripled
The median value per US user of AI tools tripled in a single year — from 2025 to 2026. This extraordinary growth in perceived value explains why AI adoption is accelerating even among users who were initially skeptical.
3× growth in perceived value
The Workforce Reality: -20% Youth Jobs, and One-Third of Employers Planning Cuts
This is where the Stanford report becomes less celebratory — and more honest than most of the industry conversation allows itself to be. The workforce impact of AI has moved from future prediction to present data.
Entry-Level Software Developer Jobs Down Nearly 20%
Employment for software developers ages 22 to 25 has fallen nearly 20% from 2024. Employer surveys point to further change ahead, with one-third of respondents expecting workforce reductions over the coming year. This is the first white-collar job category to show measurable, AI-attributable contraction. It will not be the last.
First white-collar category to contract
64% of Americans Expect Fewer Jobs — Experts Are More Optimistic, but Expect Faster Change
Nearly two-thirds of Americans (64%) expect AI to lead to fewer jobs over the next 20 years. Experts are less pessimistic — 39% predict fewer jobs, 19% predict more — and they forecast far faster adoption, expecting generative AI to assist 80% of U.S. work hours by 2030, compared to the public’s estimate of 10%. The gap between public expectation and expert forecast is the largest in the report’s history.
A massive expectations gap
AI Now Handles 75% of Routine Programming Tasks in Enterprise
This mirrors the finding from Anthropic’s own 2026 labor research, which found that AI now handles 75% of routine programming tasks in monitored enterprise environments. This is not a prediction about what will happen. It is a measurement of what is already happening in production environments at major companies today.
Already happening, not coming
US Talent Immigration Crashed 89% Since 2017 — Down 80% Last Year Alone
The number of AI researchers and skilled developers relocating to the United States dropped 89% since 2017, with an 80% decline in the last year alone. America builds the most powerful AI — but is struggling to attract the people who will build the next generation of it. This is a slow-moving structural crisis with no quick solution.
A quiet talent emergency
The correct interpretation: The Stanford data does not support “AI will eliminate all jobs.” It supports something more precise and more actionable: AI is eliminating tasks, redistributing work, and shrinking the teams required to achieve the same output. The person who learns to direct AI well produces what previously required three people. The person who doesn’t sees their competitive position erode. The jobs don’t vanish — they transform, and the transformation speed is outpacing the education system’s ability to respond.
Education Is Failing: 80% of Students Use AI, 6% of Teachers Have Clear Policies
Perhaps no section of the Stanford report reveals a more urgent governance failure than the education data:
80%+ of Students Use AI for Schoolwork
Over 80% of U.S. high school and college students now use AI for school-related tasks, but only half of middle and high schools have AI policies in place, and just 6% of teachers say those policies are clear. Students are building habits around AI in a policy vacuum.
Governance vacuum — urgent
UAE, Chile, South Africa Lead AI Skill Growth
AI engineering skills are accelerating fastest in the United Arab Emirates, Chile, and South Africa. The talent geography of AI is shifting in ways that don’t track current investment maps — and that will shape competitive advantage for decades.
New talent geography emerging
A Generation With Wildly Uneven AI Skills
Because policies are absent, students in some districts are learning to deploy AI effectively while others operate in a complete vacuum. The result: a graduating workforce entering the labor market with enormous variation in AI fluency — a gap that will compound over careers.
Inequality will compound
AI in Medicine: Promise vs. Thin Evidence
Physicians reported up to 83% less time spent writing notes and significant reductions in burnout. But a review of more than 500 clinical AI studies found that nearly half relied on exam-style questions rather than real patient data, with only 5% using real clinical data. The evidence base remains thin.
Real value, thin evidence base
The Hidden Environmental Price Tag: 72,816 Tons of CO₂ for One Model
This chapter of the Stanford report is the one the industry least wants to discuss — because it puts concrete numbers on costs that have been allowed to remain abstract.
— Stanford HAI 2026 AI Index Report
Water: 12 Million People’s Drinking Water
Annual GPT-4o inference water consumption alone may exceed the drinking water needs of 12 million people. Every query you type costs fractions of a milliliter of water somewhere in a server cooling system. Multiplied by billions of queries per day, the number becomes difficult to justify without scrutiny.
The cost of every query
Power: The State of New York
AI data center power capacity has reached 29.6 gigawatts — enough to power the entire state of New York at peak demand. This figure doubles roughly every 12-18 months as compute capacity scales with model size and usage growth.
Doubling every 18 months
CO₂: 17,000 Cars for a Year — Per Model Training Run
Training a single frontier model like Grok 4 produces 72,816 tons of CO₂ equivalent. With models now being released monthly — GPT-5.3, 5.4, 5.5 in consecutive months — the cumulative environmental burden is growing faster than efficiency gains can offset it.
Planetary cost per model
The Efficiency Paradox
Models are becoming more efficient — DeepSeek V4 achieves comparable performance at a fraction of traditional training cost. But Jevons’ Paradox applies: when something gets more efficient, people use more of it. Total AI compute consumption continues rising despite per-query efficiency improvements.
Efficiency eaten by scale
Governance Is Falling Behind: Companies Are Publishing Less Safety Data, Not More
One of the most alarming structural findings in the 2026 Stanford report is not about what AI can do — it’s about what the companies building AI are choosing not to tell us about what they’re building.
— Stanford AI Index 2026, Governance Chapter
What the data shows: The 2026 AI Index finds that responsible AI reporting has lagged significantly behind capability development, with most AI companies not publishing detailed safety evaluations, bias audits, or transparency reports. When a new model launches, the safety card matters as much as the benchmark chart — and too often, there is no safety card. “A lot of companies are not releasing how their models do in certain benchmarks, particularly the responsible-AI benchmarks. The absence of how your model is doing on a benchmark maybe says something.”
The concentration risk: Five hyperscalers now control more than two-thirds of global AI compute. This concentration creates systemic fragility — an outage, policy change, or pricing shift at a single provider can affect the entire ecosystem. This is not a warning about future risk. It is a description of the current architecture of global AI infrastructure.
The Jagged Frontier: Why the Same AI That Wins at Math Fails at Clocks
The most intellectually honest concept in the entire Stanford report is what the researchers call “the jagged frontier” — and it is the most important thing to understand if you are actually using AI in real work.
— Stanford AI Index 2026 / Stark Insider Analysis
This jagged frontier creates a dangerous cognitive trap: some managers see the extraordinary results (gold medal in mathematics!) and assume the model is uniformly excellent. Others see the absurd failures (can’t read a clock!) and dismiss the technology entirely. Both are wrong. The truth is more actionable: AI is like a brilliant specialist who is a genius in specific domains and a naive amateur in others — and the skill is knowing which is which for your specific task.
The practical rule: If you are putting AI into a workflow that matters, evaluate it on your actual work, not on someone else’s benchmark suite. A model that aces graduate-level science can still misread a clock or confidently cite a paper that does not exist. The jagged frontier means you must always test on your specific task — general benchmarks are necessary but not sufficient.
What This Means for You: A Practical Guide from Every Number
For Business Leaders and Managers
88% of your competitors are using AI. One-third are planning to reduce headcount. If you don’t have a data-driven AI strategy — not a pilot, not a chatbot on your website, but an actual strategy for which workflows to augment, which to automate, and how to retrain affected employees — you are structurally behind. The window to lead rather than follow is narrowing.
Build a real strategy, not a pilot
For Early-Career Developers (Ages 22–25)
Entry-level software developer jobs are down 20%. This does not mean software engineering is dying — it means the shape of software engineering is changing fast. Adoption tracks capability, and organizations that actually absorb AI into their workflows start to shift in ways the adoption number alone doesn’t capture. Specialize in AI orchestration, system architecture, and the high-judgment work that AI cannot yet do. The developers who direct AI best will be the most in-demand professionals of the decade.
Specialize in directing AI, not competing with it
For Educators and Students
If you’re an educator without a clear AI policy, you are in the 94% majority — and that majority is producing students with wildly inconsistent AI fluency. The students who leave your institution knowing how to deploy AI effectively will have a massive advantage over those who don’t. Build a policy that treats AI as a thinking tool, not a cheating tool.
Urgent for educational institutions
For Everyone Concerned About the Bigger Picture
The 2026 Stanford report describes a technology that is genuinely extraordinary, genuinely valuable to consumers, and genuinely under-governed. The companies building AI are reporting less safety data, not more. Across every sector studied, the pattern is the same: AI capability and adoption are moving faster than governance and policy frameworks. If you believe governance matters, the time to push for it is now — while the frameworks are still being written, not after the patterns are entrenched.
The governance window is open — briefly
FAQ: Your Stanford AI Index 2026 Questions Answered
📚 Primary Sources & References
- Stanford HAI — 2026 AI Index Report (Official) · Published April 13, 2026
- Stanford HAI — Inside the AI Index: 12 Takeaways
- AI Automation Global — Stanford AI Index 2026: State of AI in 12 Key Findings
- Search Engine Journal — AI Adoption Outpaced the PC & Internet
- Artificial Studio — The State of AI in 2026
- Stark Insider — Stanford 2026 AI Index: Where AI Actually Stands
- The DC Median — 20 Takeaways from Stanford’s 2026 AI Index
- MIT Technology Review — Charts That Explain the Current State of AI
📊 Stay Ahead of the AI Data
The Stanford AI Index comes out once a year. But AI changes every week. Subscribe free to our weekly briefing for the numbers that matter — analyzed, contextualized, and delivered before everyone else is talking about them.